The striking result in Pei and colleagues’ paper is the gap between the scans and the fracture tests. For the young adult male Beclin-1-deficient mice, the losses relative to wild-type were 23.7% in maximum load and 31.9% in work to fracture. Those are substantial changes in the force sustained and the energy absorbed by a femur. The main scan comparisons, by themselves, had not identified a significant group difference.
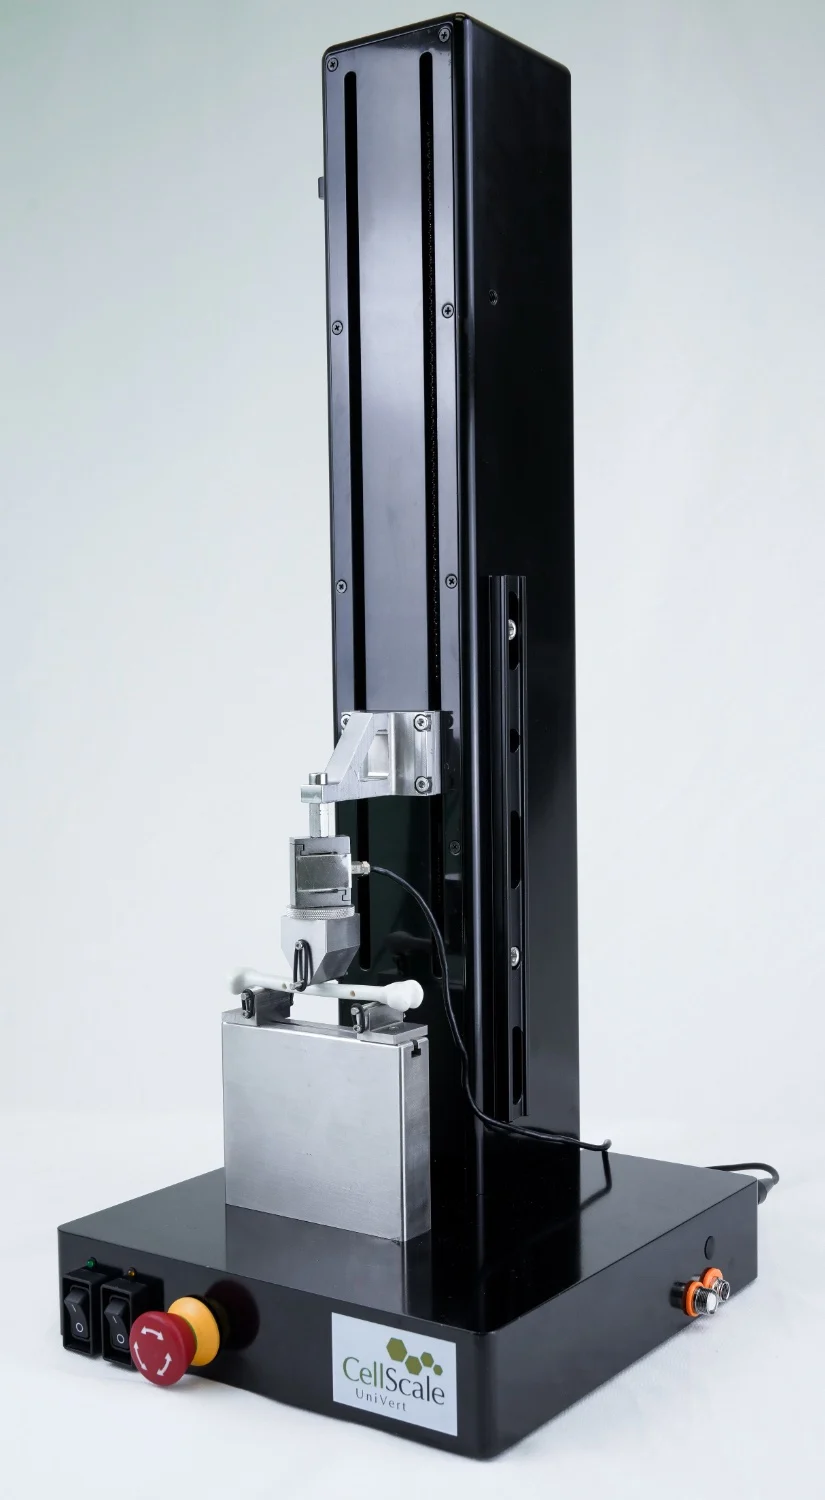
Bone mass, cortical geometry, tissue mineral density: the principal micro-CT comparisons were nonsignificant for all three. The loss of mechanical performance emerged in mouse femur three-point bending on a CellScale UniVert mechanical testing system.
The paper then takes the reader down to the osteocytes, the cells inside bone, and the matrix around them. There is a possible biological explanation at this scale, though the cause of the weakness remains unresolved.
Bone Mass and Geometry Remained Largely Unchanged
There were two genotypes, with age and sex held the same: males, 14 weeks old, either Becn1+/− or wild-type (WT). Becn1 is the gene encoding Beclin-1. The experimental animals had a heterozygous deficiency, denoted +/−, reducing expression of this protein involved in autophagy-related processes and skeletal homeostasis.
The scan analysis was split by site. For trabecular bone at the distal femur, the recorded quantities were volume fraction, thickness, number, and separation. The mid-diaphyseal cortical measurements were area, thickness, minimum moment of inertia, and tissue mineral density.
Across that set of measurements, the authors did not detect a statistically significant genotype difference. This leaves two things to keep separate: a difference may have escaped detection, and a scan cannot supply a direct measurement of load capacity. Bending addressed the second point.

How the UniVert Was Used for Mouse Femur Three-Point Bending
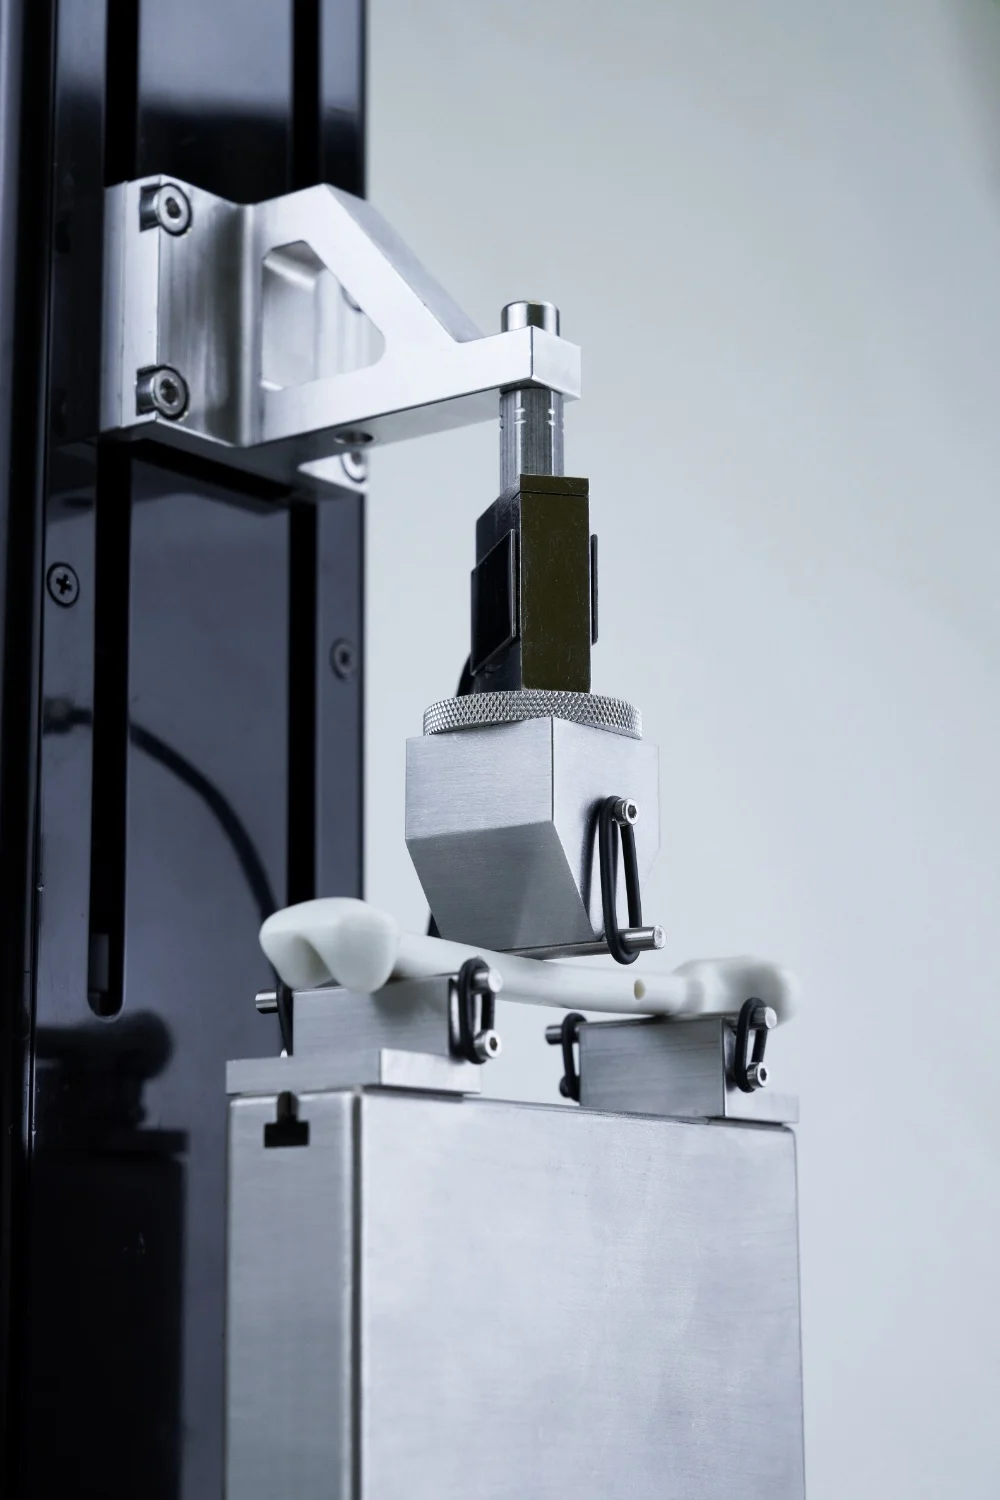
The mouse femur three-point bending experiment used the already-scanned femurs, six per genotype. Support spacing was 7 mm, with a consistent anatomical orientation for the specimens.
A 0.1 N preload brought the loading contact onto the bone. The test then ran to failure at 0.05 mm/s, collecting force-displacement measurements at intervals of 0.2 seconds.
For three-point bending testing, picture the femur lying across a pair of supports. The third contact applies load between that pair. In this experiment it kept moving until the bone fractured, while the instrument recorded the force and displacement.
The curve analysis was done separately, in a Python program called 3PB-Analyzer. From the UniVert data, the authors obtained maximum load, stiffness, yield load, post-yield displacement, and work to fracture. For apparent bending modulus and ultimate bending stress, they also needed the femur geometry measured on micro-CT.
Each tested femur therefore had its own scan data as well as its bending curve. That pairing supported the authors’ comparison of specimen geometry and mechanical behaviour.
Bone Mechanical Testing Revealed Significant Reductions in Strength
Mouse femur three-point bending separated the two groups once the bones were loaded to failure. The Becn1+/− femurs had lower maximum load and stiffness, and less work was required to fracture them. The geometry-based estimates of modulus and stress were lower too.
Reduced Bone Mechanical Properties in Becn1+/− Mice
Percentage reduction compared with wild-type controls
Yield load also fell significantly. For post-yield displacement, however, the group comparison did not reach statistical significance.
The 31.9% reduction in work to fracture was the largest percentage change in the panel. To read these results, it helps to go back to the curve. Its highest force is maximum load. The elastic portion supplies the slope used for stiffness, and the area accumulated up to failure gives work to fracture, or absorbed energy. The five percentages therefore describe several aspects of the response.
A thicker or differently shaped cortex can affect a whole bone’s response to bending. Here, apparent bending modulus and ultimate bending stress were lower even after the calculations incorporated the measured geometry. That points beyond cortical geometry alone, without turning these bending estimates into direct measurements of an isolated material.
The authors also tested tibial cortical bone by Vickers microindentation on a separate instrument. Hardness-derived Young’s modulus estimates were 8.0% lower in Becn1+/− mice (p = 0.0020). This was a different experiment on a different bone; the UniVert supplied the femoral bending data.

Changes in Osteocyte Canaliculi Accompanied Weaker Cortical Bone
For this part of the investigation, the methods changed to silver nitrate staining and transmission electron microscopy. The authors were looking much closer to the cells themselves.
The terminology follows the anatomy. Lacunae are the cavities occupied by osteocytes in the mineralized matrix. Canaliculi are the narrow channels housing their processes. The name osteocyte lacunar-canalicular system covers this connected network, which is involved in fluid transport, communication, and sensing mechanical loading.
In the Becn1+/− specimens, the channels were shorter and wider. Canalicular length fell by 44.2%, mean width rose by 34.3%, and pericanalicular space thickness rose by 27.7%. There were five mice per group for length and width measurements, and six for pericanalicular thickness.
The main cortical dimensions on the scans had produced nonsignificant comparisons; here, the measurements around osteocyte processes differed. The drawings in Figure 3 put the channel measurements alongside an illustration of the network.

The mineral analysis added a location-specific finding. Calcium-to-phosphorus atomic ratio was 14.4% lower at the lacunar wall in Becn1+/− bone. The corresponding ratio in the surrounding interstitial cortical matrix showed no statistically significant difference.
Fluorescence signals associated with acidification increased. Expression increased in the cortical assays for Atp6v0b, Ctsk, and Acp5, three genes associated with remodeling.
The genotype comparison puts the tissue changes alongside the bending results. It cannot, on its own, tell us whether the altered osteocyte environment produced the weaker bone. That is the mechanism still to be tested.
What Do These Findings Mean for Bone Quality Research?
For this model, a study based on the principal micro-CT endpoints alone would have missed the loss of mechanical performance measured by mouse femur three-point bending. The bending tests supplied a result the scans could not: how the femurs responded as force increased toward failure.
The choice of endpoint follows from that result. A question about maximum load calls for a loading experiment. A question about cortical shape calls for imaging. In this case, the combination was useful because the scans supplied geometry for the bending calculations, while the tissue assays investigated what else had changed.
There are six animals per genotype behind the main mechanical comparison, and the result concerns males at 14 weeks. There is no age series here to locate the onset of weakness, or a same-age female group to test a sex difference. Nor was restoration of strength tested by modifying the canalicular environment.
The group’s earlier study is an especially useful reminder of that scope. In seven-month-old female Becn1+/− mice, the authors reported thicker cortices and improved mechanical performance, again using UniVert femoral three-point bending.
The two papers differ in both age and sex. Either could matter, and these comparisons cannot separate their effects or establish a progression with age. That is a reason to check the mechanics in the particular skeletal disease, ageing, or treatment model under investigation.
About the CellScale UniVert Mechanical Testing System
Mouse femur three-point bending is one use of the benchtop CellScale UniVert. The system also supports tension and compression, with fixtures and load cells selected for the biological tissue, biomaterial, or engineered construct being tested.
For Pei’s experiment, the UniVert recorded force and displacement during controlled loading. The full analysis also needed the separate micro-CT measurements and the authors’ 3PB-Analyzer workflow. This distinction matters when planning a similar experiment: acquiring a curve is one step, and calculating geometry-based properties is another.
For another bone strength testing project, the setup starts with the specimen. A mouse femur’s dimensions influence where it can be supported and loaded. Expected forces guide load cell selection, while the intended endpoint determines how far to load and what to extract from the curve. This paper’s 7 mm span and 0.05 mm/s rate describe its protocol, rather than a setting for every bone test.
There are other routes into bone-related research with the UniVert. Tensile testing of electrospun bone tissue engineering scaffolds has compared dry and hydrated specimens. A University of Michigan team took another approach, developing a custom UniVert-based ACL injury model with 3D-printed fixtures for controlled preclinical joint loading.
The fixture and protocol change with the question. Further examples are available through CellScale’s Bone Tissue Engineering & Mechanics applications.
Planning Mouse Femur Three-Point Bending or Other Bone Mechanical Tests?
Have a bone testing project in mind? Contact CellScale with your specimen dimensions and expected forces to discuss mouse femur three-point bending, bone strength comparisons between groups, or another UniVert application in musculoskeletal biomechanics.
Original Research Publication
Qilin Pei, Xia Qin, Yutao He, Lingxia He, Xi Li, Bin Wang, Reduced cortical bone strength and altered osteocyte canaliculi despite preserved bone mass in male Becn1+/− mice, Bone, Volume 215, 2027, 118151, ISSN 8756-3282, https://doi.org/10.1016/j.bone.2026.118151.