Five centimetres has a clinical role in decisions about selected ascending aortic aneurysms. Its significance as a boundary between two tissue states is less clear. A 2026 study in JTCVS Open examined that question using human aortas collected at the University of Ottawa Heart Institute.
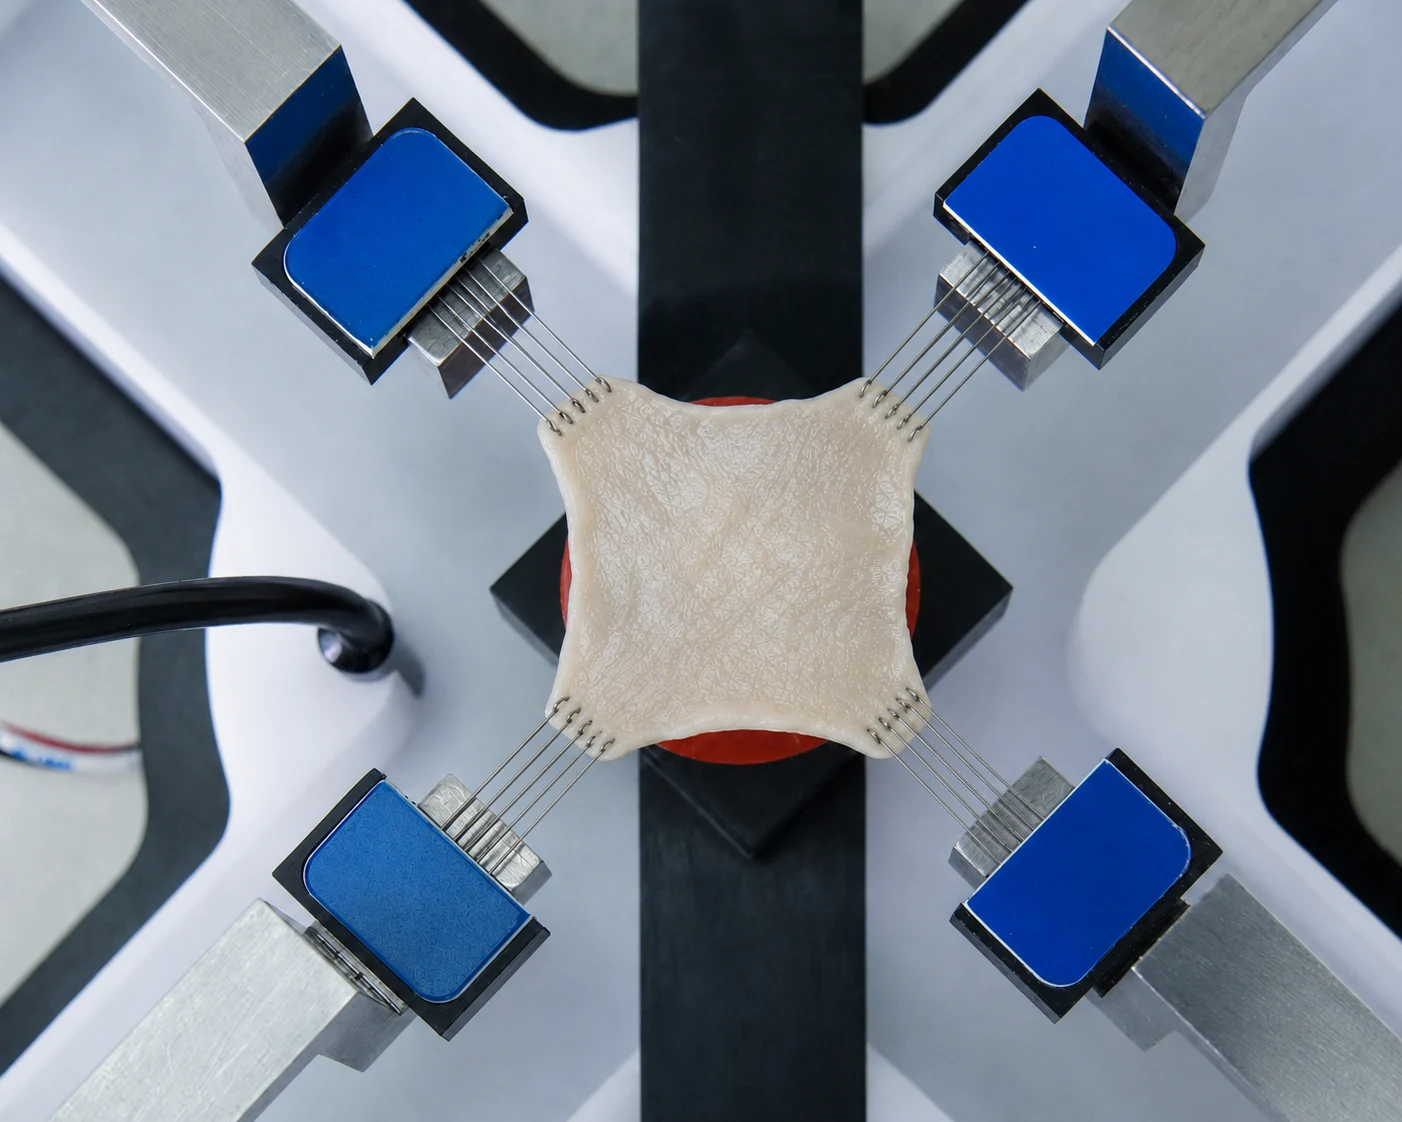
The investigators paired cut-ring measurements with aortic tissue biaxial testing on a CellScale BioTester 5000. Aneurysm specimens were generally stiffer than controls, including specimens from aortas below 5 cm. Between the two aneurysm groups, though, the stiffness comparisons found no significant difference. Opening angles did separate the groups.
There are two results to reconcile in this aortic aneurysm biomechanics study. Why did the cut rings separate by aneurysm size when aortic wall stiffness did not?
Aortic Aneurysm Biomechanics and the 5 cm Surgical Threshold
On CT, the relevant measurement was maximum ascending aortic diameter. To find out how a piece of its wall stretches, we need a loading experiment. The answer depends partly on the wall’s composition: elastin contributes to recoil, while collagen fibres take up more of the load with increasing extension. Remodeling of those constituents and the surrounding cellular matrix can change the measured response.
There is another measurement to keep separate here: strength. The tests reported here measured how tissue deformed during loading, without taking it to failure. A claim about dissection or rupture would need evidence of failure behaviour as well.
To study ascending thoracic aortic aneurysm mechanical properties, the team compared excised tissue from the two diameter categories. These samples could be cut and loaded in ways unavailable during a clinical scan.
In vascular tissue engineering and biomechanics, the choice of experiment determines which part of that description becomes accessible. Here it supplied loading curves and the shape of cut rings.
Measuring Aortic Aneurysm Biomechanics with Human Tissue

Tissue came from elective aneurysm repairs in 71 patients. Another 31 control aortas came from heart-transplant donors or recipients. The CT-based split was fairly even: 37 aneurysms measured less than 5 cm before surgery, and 34 measured at least 5 cm.
Excised tubular segments were tested fresh or refrigerated at 4°C for testing within 24 hours. From the distal segment, the team prepared up to three rings, each approximately 3–4 mm high. Images recorded each ring before a radial cut and again after 30 minutes of equilibration. The change in geometry supplied the opening-angle measurement.
For the loading experiments, up to four 1 × 1 cm squares came from different positions around each aorta. Not every aorta yielded suitable biaxial specimens. The loading results came from 55 aneurysm patients and 18 controls, a smaller set than the original tissue collection.
How the BioTester Was Used to Measure Aortic Wall Stiffness
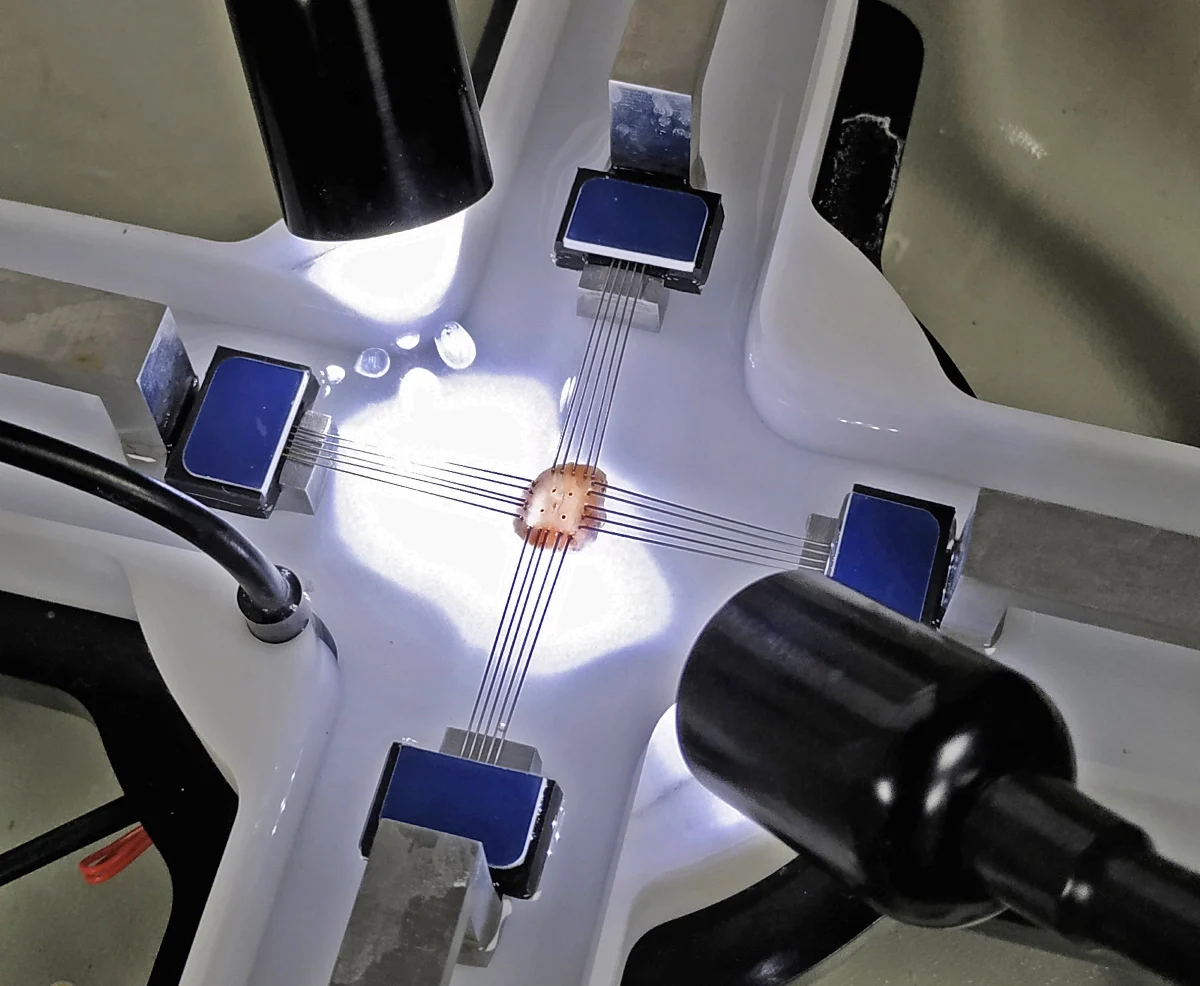
On the BioTester 5000, the setup used 5 N load-cell capacity. Ten cycles of preconditioning preceded nine loading protocols. For the comparisons discussed here, the team selected the equibiaxial protocol: circumferential and longitudinal membrane tensions were equal, with deformation measured in each direction.
Planar biaxial testing supplies both loading directions within one experiment. Here, the responses were expressed as second Piola–Kirchhoff membrane tension and Green strain. Tangent stiffness was evaluated at 60 and 120 N/m, allowing comparisons at specified points on the nonlinear response rather than reducing the whole curve to one stiffness value.
Aortic Wall Stiffness Was Already Elevated Below 5 cm
At 60 N/m, the reported circumferential tangent stiffness values were:
– Controls: 542 ± 22 N/m.
– Aneurysms below 5 cm: 625 ± 25 N/m.
– Aneurysms at or above 5 cm: 696 ± 26 N/m.
Along the longitudinal axis, the control result was 497 ± 25 N/m; the smaller- and larger-aneurysm results were 595 ± 26 and 676 ± 33 N/m, respectively. At this tension, both aneurysm groups differed significantly from controls in both directions.
At 120 N/m, circumferential stiffness remained significantly higher in both aneurysm groups than in controls. The two aneurysm means were close: 1,636 ± 138 N/m below 5 cm and 1,603 ± 84 N/m at or above 5 cm. Neither loading level produced a statistically significant stiffness difference between the aneurysm groups.
The strain comparison tells a similar story at 120 N/m. Controls reached a mean longitudinal Green strain of 0.260. Both aneurysm groups reached 0.224, a lower deformation at the same tension.
It would be easy to read the three means at 60 N/m as successive stages of stiffening. Yet the two aneurysm means at 120 N/m are almost the same. Taken with the nonsignificant comparisons between aneurysm groups, these results offer no clear stiffness boundary at 5 cm. They also leave room for differences the experiment could not resolve.
Loading conditions also matter in other aortic experiments. For a different remodeling stimulus, see the earlier aortic biaxial testing following intermittent hypobaric hypoxia, which examined directional stiffness and viscoelastic behaviour.

Residual Stress Changed Differently from Tissue Stiffness
For the rings, the starting observation was their unloaded shape. An excised ring can look unloaded and still contain residual stress within its wall. Make a radial cut, and the ring opens as some of that stress is released.
For controls, the mean opening angle was 182 ± 10°. The smaller aneurysms opened to 261 ± 12°; the larger ones to 310 ± 14°. This time, every pairwise group comparison was significant. In this measurement, the diameter categories remained distinguishable after the stiffness comparisons had ceased to separate them.
An opening angle is still an angle. It records the shape after cutting rather than a stress magnitude, and its size alone cannot tell us whether loading in the intact wall would be more harmful.
Residual stretches calculated from the closed and open ring geometries showed no significant group differences. These calculated quantities and the observed angle describe different features of the deformation. Interpreting them requires attention to the geometric assumptions, especially for a layered arterial wall.
The rings therefore support an association between aneurysm size and residual mechanical state. The experiment does not settle what that association means for the distribution of loading in an intact aneurysm.
Aortic Aneurysm Biomechanics Vary Considerably Between Patients
Figure 3 shows why the averages need company. The distributions of opening angle and biaxial stiffness overlapped, even where the group comparisons were significant. Smaller aneurysms included specimens with stiffness values comparable to larger aneurysms, as well as specimens closer to the control range.
For circumferential stiffness at 60 N/m, about 22% of aneurysms below 5 cm exceeded the control group’s 95th percentile. In the larger group, about 49% did. That percentile served as a reference for describing the distributions; it was not validated as a clinical cutoff.

A separate analysis treated unloaded aortic radius as a continuous variable. At 60 N/m, its correlations with stiffness were r = 0.661 circumferentially and r = 0.605 longitudinally. Larger unloaded radii were associated with greater stiffness, despite the overlap between diameter groups.
These analyses answer different questions. A correlation with radius can coexist with a nonsignificant comparison across a selected diameter boundary. Also, unloaded radius measured from excised tissue and maximum diameter measured on preoperative CT represent different measurement conditions.
Why Aortic Tissue Mechanical Properties Matter Beyond Diameter
The study gives several ways to describe the wall, without making any one measurement sufficient. Stiffness separated aneurysmal tissue from controls. Opening angle distinguished all three diameter categories. The overlap between specimens prevents those findings from becoming a simple classification rule.
What produced the spread? The arrangement of collagen and the condition of elastin could both contribute, along with matrix composition and local remodeling. Age, hypertension, and valve phenotype are also candidates. These remain explanations to investigate, rather than causes established by this experiment.
A second restraint concerns time. No aorta was followed from the smaller category into the larger one. Each sample belonged to a different patient at one point in time. We therefore cannot use the group differences to reconstruct an individual’s course of remodeling. Statements about the pace of remodeling would require longitudinal evidence.
Failure was outside the testing scope, too. Neither tensile strength nor failure behaviour was measured, leaving no basis here for predicting which aneurysm would rupture or dissect.
One use for these measurements is to inform vascular models. In the earlier work on human carotid artery biaxial testing, measured tissue properties and axial pre-stretch affected predictions of arterial deformation. That is another setting where the experimental choices shape what the model predicts.
For clinical translation, there is a missing connection to establish. Imaging-derived strain and other non-invasive measures would need to be compared with the properties measured in excised tissue. These ex-vivo findings do not establish that connection.
The BioTester in Cardiovascular Tissue Research

A CellScale BioTester experiment begins with the specimen and its attachment. BioRakes, hooks, and sutures are among the options. For aortic tissue, the specimen is oriented so that loading along the two perpendicular axes retains the circumferential and longitudinal directions of the vessel.
The loading protocol then sets the question: equal membrane tension in each direction, as in the Ottawa comparison, or unequal tensions to examine other responses. Force and displacement are recorded during testing; imaging-based tracking can add local strain measurements.
From those responses, researchers can examine how stiffness changes with loading and whether the two directions behave differently. Related methods are used for vascular grafts, valve tissue, pericardium, and other materials exposed to loading in multiple directions.
CellScale’s collection of vascular biomechanics research by a prominent BioTester user includes further examples involving arterial aging, deformation, and medical device interactions.
In the Ottawa experiments, biaxial loading supplied evidence of altered tissue mechanics below 5 cm, but no significant stiffness separation between the aneurysm groups. Read alongside the cut-ring results, it shows why an experimental description of an aneurysm needs more than its diameter.
Original Publication
Noor Ghadie, Michel Labrosse, Munir Boodhwani, Biomechanical Remodeling of Ascending Aortic Aneurysms Across the 5-cm Surgical Threshold, JTCVS Open, 2026, 102197, ISSN 2666-2736, https://doi.org/10.1016/j.xjon.2026.102197.
This article is based on the journal pre-proof accepted October 9, 2026.